
What Great Service!...I've used Air Equipment for over 5 years now, I have always been impressed with their technical abilities and speed of response...
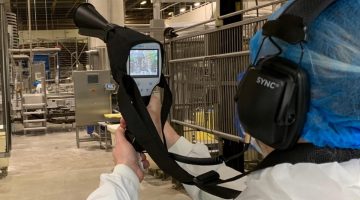
Datalogging your air compressors is the only really accurate way to identify how much work your air compressors are actually doing. The basic process is to measure the power being absorbed by the compressor over a period of a few days to a few weeks. This also gives a very good indication of how much air is being produced by the compressor. The conversion from power absorbed by an air compressor to compressed air created is well understood and pretty accurate.
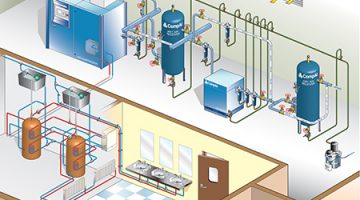
The way we do a datalog of customer compressors is to attach a small datalogger to each compressor in a customers system. The logger is a small box or electronics that records absorbed power once a second. The data is stored in the logger which can then be transferred to a computer and analysed by specialist software.
We tend to do logging over a period of a minimum of 7 days, since this gives a good indication of demand across the full week including weekends. We also tend to do the logging outside of holiday periods so we get a good average of likely system demand.

The basic output of a datalog is a series of graphs showing compressed air demand across 7 typical days of usage. It also shows energy usage The software combines all the data from all compressors to give overall demand as well as showing which compressors are used at which times and how the compressors are sequenced during ramp up or ramp down of air demand.
Many air compressor software programmes will also show how much energy would be used if different compressor(s) were used to supply the same amount of compressed air. This is where the potential savings from a variable speed compressor is established.
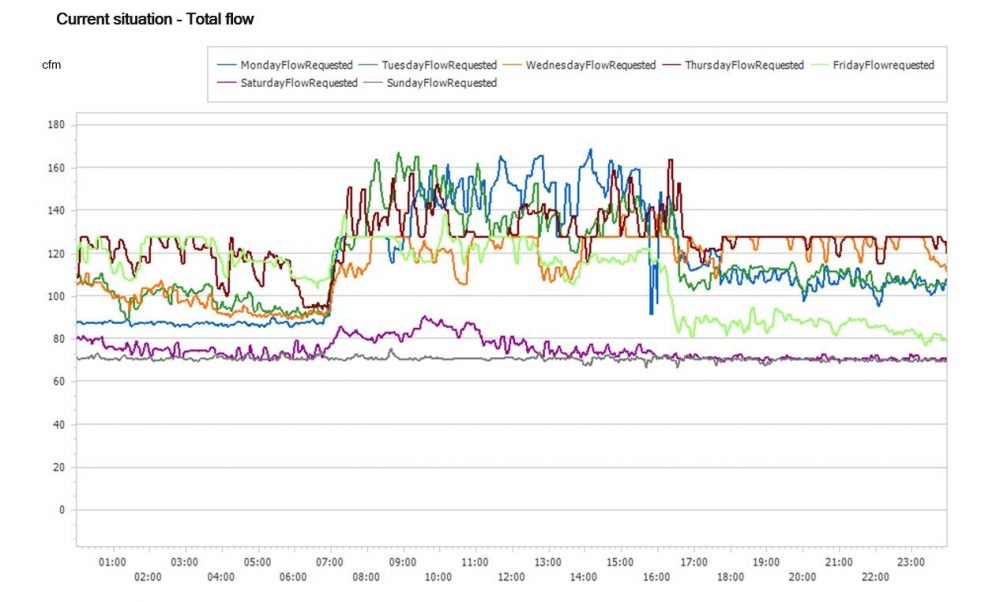

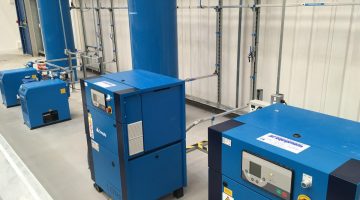
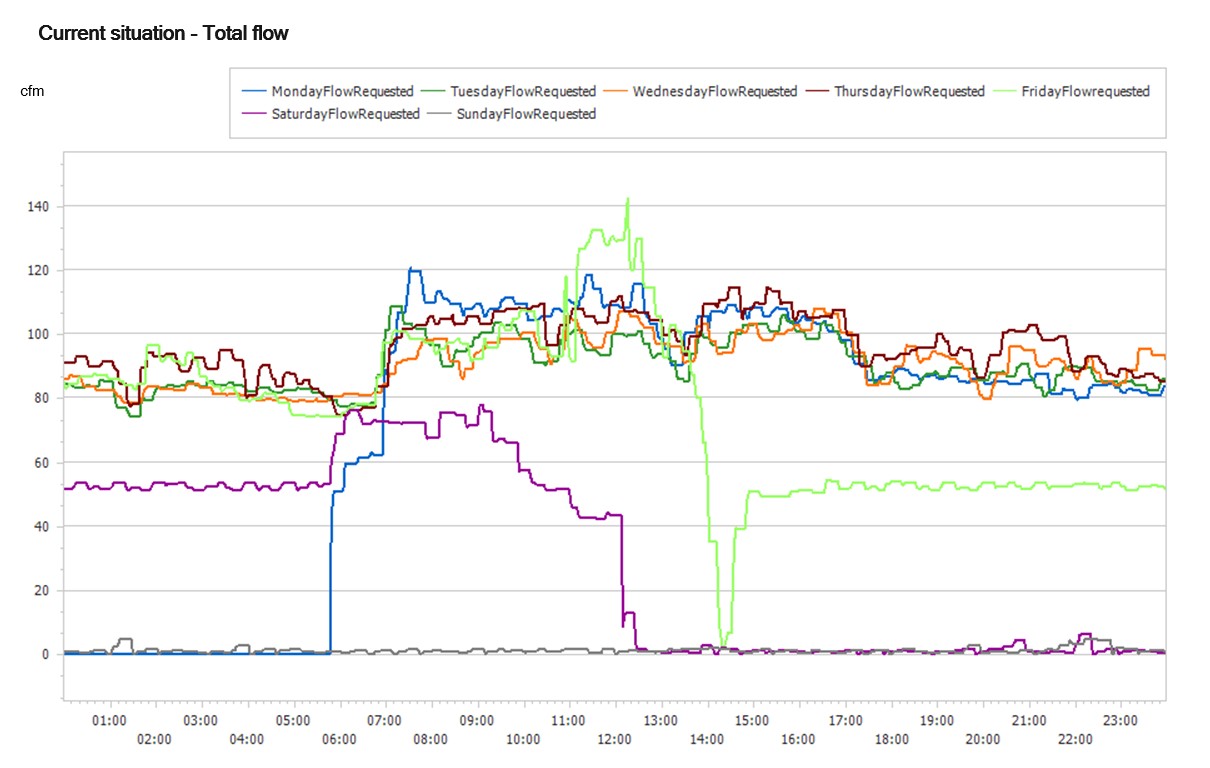
Below are a couple of basic charts from a typical datalog of a compressor system. This system consisted of a total of 3 compressors (1 x 15kw & 2 x 11kw). The factory runs 5 days a week, having a day and evening shift, plus Saturday mornings. The first chart shows the system before we did work on the system to fix leaks, solve some pipework restrictions and install a timed valve on the outlet of the air receiver. The second chart shows the effect after we had made these changes.
Each chart shows 7 days of total air usage vs time of day. The line for each day is shown on top of each other, with each day’s demand shown in a different colour. The time is shown across the bottom is midnight to midnight. Air usage is shown in cfm. These charts are made up from energy absorbed by all 3 compressors added together.
Find out more about this datalog here
Chart 1 shows the air demand from the factory when we first logged the site. as can be seen the average demand was about 120 – 130 cfm with leak demand of about 170 cfm. Saturday afternoon & Sunday demand was about 70cfm, when no work was actually being done.
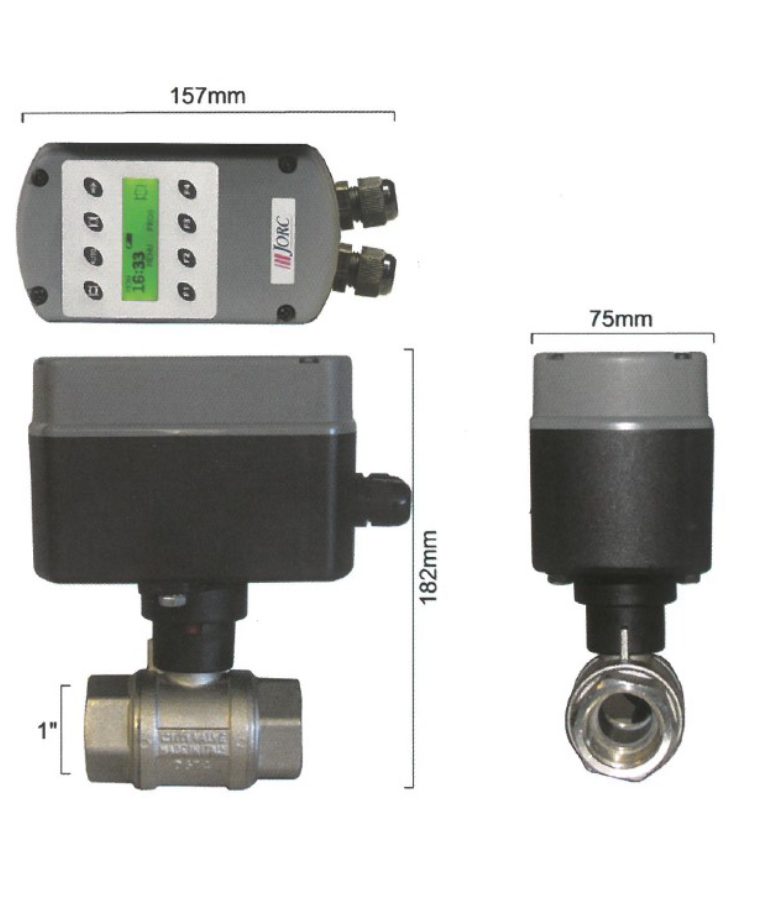
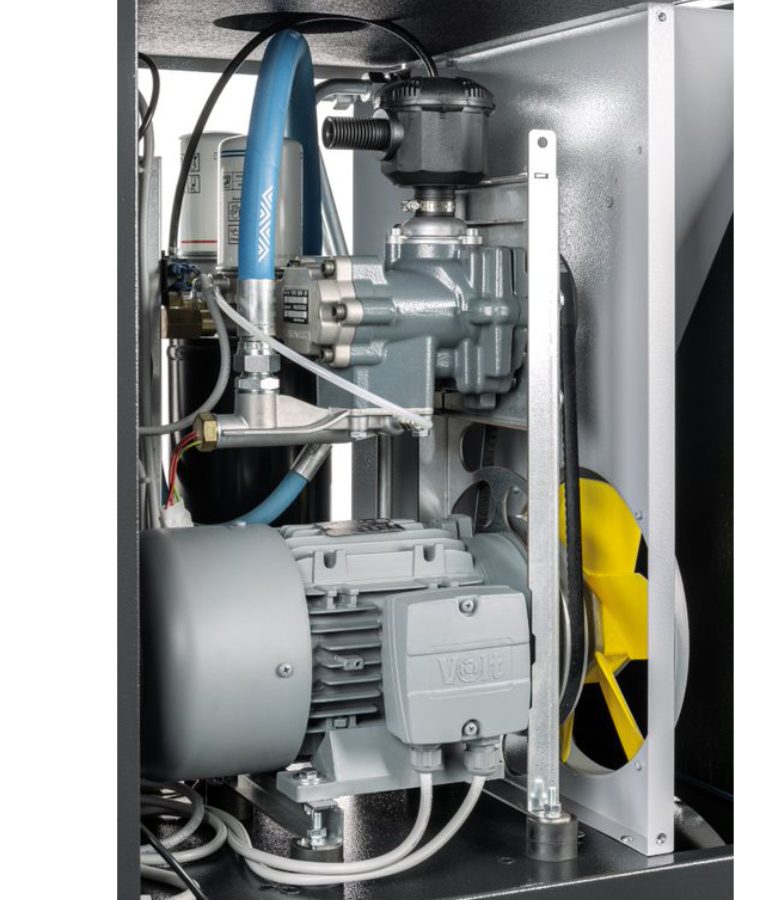
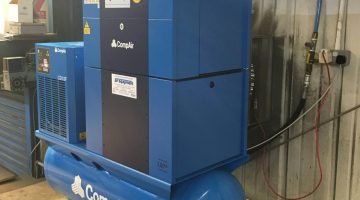
Chart 2 shows air demand after we have completed some work on the site which included fixing approx 40 cfm of leaks, increasing the size of the plant room pipework and fitting a timed valve on the outlet of the receiver. Points to pick up on are:
– the overall average demand has fallen to about
– The peak demand has dropped to about 140cfm
– The demand over the weekend (when the timed valve has shut) has dropped to zero.
Find out more about the timed valve (air saver) here
Based on the principle you can ‘only improve what you measure’ a datalog will give us the data required to accurately understand how your air compressors are being used. From the data file we can model, using state of the art predictive software, what will happen to energy consumption when we change certain parameters, such as system pressure or compressor size.
This give us the ability to quantify, in saved costs, the effect of making specific improvements to your system


What Great Service!...I've used Air Equipment for over 5 years now, I have always been impressed with their technical abilities and speed of response...
Really understand your compressed air system energy usage with a datalog
Compressor maintenance, service and repairs
At the heart of the Air Equipment business is an in depth knowledge of compressors and compressed air systems. Between us we have hundreds of years experience servicing, repairing and installing compressors. Our depth of experience means that we can rapidly find solutions to customers concerns, minimising the effect of delays and downtimes.
Learn about usSign up to the free newsletter and receive our monthly bulletin.